Align a Historical Map With a Modern One—or Show Why They Do Not Fit
Align a Historical Map With a Modern One—or Show Why They Do Not Fit
Georeference a historical map only as far as the correspondence between the two maps can be defended. Identify the same features, record why you believe they match, compare transformations, and check landmarks that did not help fit the image. If the operation makes the old map appear more precise than its evidence allows, use an unwarped comparison instead.
That choice belongs to the documentary argument, not just the software settings. An overlay might help a pitch reader understand where a former mill stood. It might also appear to settle a property line, establish the width of a yard, or prove that a river moved. Those are different claims. A visually persuasive alignment does not give them equal support.
The working example below uses an invented town plan whose mill yard has been deliberately exaggerated. An executed comparison produces a useful contradiction: the flexible transformation fits the control points almost perfectly and performs substantially worse at the independent check landmarks. The answer is not to make the overlay prettier. It is to change what the pitch asks the maps to demonstrate.
Decide what the comparison is allowed to establish
Write the proposed caption before doing any alignment. Start with the strongest claim you are considering, not a conveniently vague version of it.
“The mill occupied this exact parcel” needs different support from “the plan places the mill near the crossing.” The second statement describes a relationship within the source. The first connects that representation to a particular modern location. An overlay can make the weaker evidence look like it supports the stronger statement, even when the caption stops short of saying so.
For a real source, record its title, creator, date or date range, purpose, archive identifier, and the particular copy or scan you are using. Ask what kind of representation it is. Was it intended to measure land, illustrate a route, explain a system, or make selected places conspicuous? Where that purpose is unknown, keep it unknown. Do not infer survey precision from elaborate linework.
Give the modern reference the same scrutiny. Record the dataset and version, coordinate reference system, and reason for treating each relevant feature as a usable reference. Calling a basemap “modern” says when you think it belongs, not whether a particular feature is accurate enough for your question.
There are two separate technical matters here: the coordinate system in which positions are expressed, and the relationship between image pixels and positions in that system. Rasterio's georeferencing documentation explicitly distinguishes them. Assigning a coordinate-system label to an image does not, by itself, establish where the mill in that image belongs.[^1]
The initial decision is therefore smaller than “Can these maps line up?” It is: “What correspondence would make this particular caption defensible?”
Make every control point an argument you can inspect
A ground control point pairs a location in the source image with a location in the reference coordinate system. In practical terms, you are saying: this mark and that mark represent the same place. Software can use that pairing. It cannot supply the historical reason for believing it.[^1]
Build a short landmark record before fitting the raster. Give each point an identifier, source-image coordinates, reference coordinates, identification basis, uncertainty note, and role in the exercise. Separate the points used to calculate the transformation from landmarks reserved to check it afterward.
A church tower is not automatically a good match because both maps contain a church symbol. The old symbol could indicate a building, a settlement, or a label position. A bridge may have been rebuilt along another alignment. These are questions to investigate, not reasons to reject every church or bridge. The useful record explains which feature you mean and why its location is comparable.
Distribute defensible points around the area the pitch will discuss. A cluster around the mill does little to challenge what the transformation does near a crossing elsewhere on the sheet. Do not add a doubtful match simply because another point would satisfy a software requirement. More unsupported assumptions do not become reliable through averaging.
Keep some recognizable landmarks out of the fit. Their purpose is different: they test what happens at locations the transformation was not instructed to satisfy. If you move a failed check into the fitting set, it is no longer an independent check. That may be a justified revision, but you must record the change and find another way to challenge the revised result.
QGIS 3.44's Georeferencer documentation describes saving and reopening a separate control-point file. Preserve that file with your identification notes; saved coordinates make the operation repeatable, while the notes make the reasoning contestable.[^2]
Compare transformations by what they are allowed to change
Choose a transformation because its assumptions suit the source, not because its result looks tidy.
A similarity-style alignment can translate, rotate, and uniformly scale an image. An affine transformation allows more, including shear and different scale along different directions; straight and parallel lines remain straight and parallel, but shape is not generally preserved. More flexible transformations can change local geometry. QGIS documents these distinctions and warns that thin plate spline, or TPS, can match the supplied controls while introducing deformation between them.[^2]
That gives you a comparison to make, not an automatic preference. If a photographed sheet is bent, additional flexibility might address something real about the capture. If a drawn yard is intentionally oversized, forcing its corners to fit could erase something meaningful about the source. The same visible mismatch can call for different treatment depending on its cause.
Keep the rendering choice separate. Resampling determines how the transformed image is sampled onto an output pixel grid; it is not a new set of historical correspondences. GDAL's warp documentation treats transformation and resampling as distinct settings.[^3] A smoother line is not evidence of a better-identified landmark.
For a controlled comparison, keep the source raster, control-point set, reference grid, output resolution, and resampling method consistent. Change the transformation you are investigating. Otherwise, a sharper export or a different crop may distract from the geometric change you need to assess.
The mill-yard example: a perfect fit to the wrong proposition
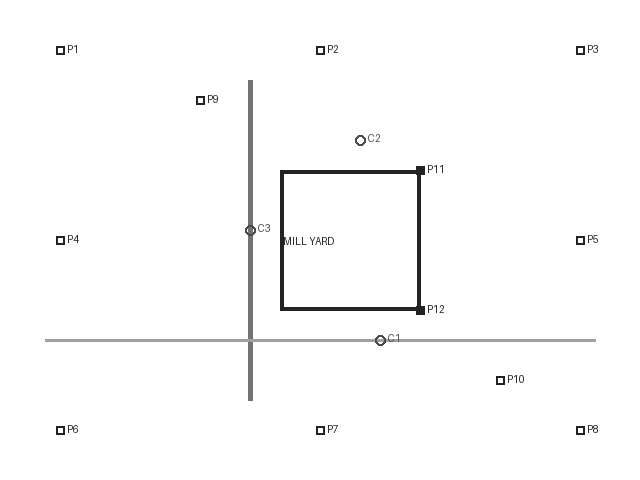
Everything in this example is fictional. There is no real town, historical boundary, or surveyed property. The exercise isolates one question: what happens when correct feature identities are combined with a mistaken assumption that the entire drawing should fit a measured plan?
The reference is a 640 × 480 local grid, with one meter per reference pixel. The old plan uses the same layout except for the mill yard: its eastern edge is drawn 80 pixels farther east. Ten fitting landmarks elsewhere remain unchanged. Two more controls identify the yard's eastern corners. Three additional landmarks—the footbridge, well, and road marker—are reserved as checks and excluded from both fits.
The correspondence is not secretly wrong. In the invented material, the eastern corner is the eastern corner. The trap is treating the drawing's enlarged yard as geometric error that should be corrected across the sheet.
Two transformations were calculated from those same twelve controls: an affine fit and a TPS fit. The accompanying script uses Rasterio 1.5.0 with GDAL 3.12.1. It writes actual georeferenced raster derivatives and saves the landmark coordinates, settings, and numerical results. These are raster previews, not screenshots of a QGIS session.[^4]
Original plan: the yard is deliberately wider than the reference yard.
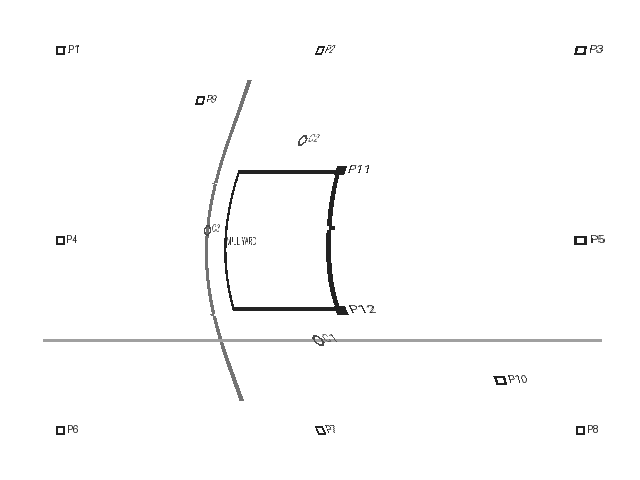
Flexible result: the fitted yard corners move into place, but the nearby road bends.
The numerical comparison separates error at fitted points from error at withheld points:
| Measurement in this fictional grid | Affine fit | TPS fit |
|---|---|---|
| Root mean square error at twelve fitting controls | 29.3 m | Less than 0.001 m |
| Root mean square error at three withheld landmarks | 13.1 m | 54.0 m |
| Footbridge displacement | 13.9 m | 61.5 m |
| Well displacement | 14.3 m | 54.6 m |
| Road-marker displacement | 10.9 m | 44.5 m |
The errors are calculated from the forward-transformed landmark coordinates, not estimated by looking at the pictures. Root mean square error here means: square each landmark's two-dimensional displacement, average those squared distances, then take the square root. It summarizes those particular points; it is not an accuracy certificate for the whole image.[^4]
The TPS fitting error is effectively zero at the displayed precision. That is exactly why it would be dangerous to stop at the fitting report. The transformation has fulfilled its instruction to place the twelve controls, including the enlarged yard's corners, at their reference positions. In doing so, it moves the withheld footbridge by about 61.5 m in this artificial coordinate system.
The affine fit cannot pull those corners inward without affecting the sheet more broadly. Its fitting residual is worse, but its independent checks fare better. That does not make the affine result suitable for claiming the yard's true dimensions. Both outputs are answering a question the old plan, as constructed, cannot answer consistently across its geometry.
This is a counterexample, not a benchmark showing that TPS is generally inferior. The data were deliberately made to expose a particular failure. On other source material, a flexible transformation may be the appropriate choice. The lesson is to test the reason for the fit rather than promoting its neatness into proof.
A failed check is a question, not an instruction to warp harder
When a check falls away from its reference, first ask which assumption it challenges. Is the feature identification weak? Has the feature moved? Is the image distorted by its capture? Is the source's geometry incompatible with the claim? The residual alone cannot distinguish those explanations.
Look locally as well as numerically. In the example, the road provides an especially plain diagnostic: a line that was straight in the original becomes curved in the flexible derivative. The operation has changed a relationship that the pitch might otherwise treat as historical information. The saved affine and TPS previews let you compare that effect with the untouched original.[^4]
A low overall error can also conceal an unacceptable error at the one location your documentary concerns. If the pitch is about the footbridge, excellent agreement at distant landmarks is not a substitute for understanding why that bridge fails its check. Decide which area matters before interpreting a whole-image summary.
Do not turn the exercise's numbers into a universal cutoff. The 13.1 m and 54.0 m values describe a fictional grid with known construction. A real project's acceptable uncertainty depends on its claim, source, reference, and intended use. A map that usefully locates a neighborhood might still be wholly inadequate for identifying a particular building footprint.
“Independent” also needs a boundary. Here it means the check landmarks were excluded from the fitted transformation. It does not mean their positions came from independent historical evidence. In a real comparison, several checks could repeat the same error from a shared reference. Record where their positions come from, not merely which software checkbox excluded them. The fictional exercise avoids that uncertainty because the reference was constructed explicitly; a real map rarely gives you that convenience.
Output resolution deserves the same restraint. The example writes one-meter pixels so both derivatives can be compared on the same grid. That is a rendering specification, not a statement that either result is accurate to one meter. Enlarging the output or requesting smaller pixels would change the file, not repair the displaced footbridge.
Nor should repeated adjustment disappear from the record. If you reject a point, change the reference, or choose another transformation, preserve why. Without that trail, a later reader sees only the surviving image and may mistake a series of editorial choices for an unambiguous measurement.
Choose an unwarped comparison when that is the honest answer
For the mill-yard example, choose the original plan beside the reference plan. Connect the mill and crossing through labels rather than implying shared pixel positions. Keep both images geometrically untouched. The comparison can explain that the plan places the yard near the crossing while visibly retaining the exaggerated yard.
Use this caption:
Fictional comparison. Both drawings place the mill yard near the crossing, but the older-style plan deliberately enlarges the yard. The images are shown separately; their outlines are not evidence of matching dimensions or exact boundaries.
The unwarped reference image is included with the original. Side by side, the discrepancy remains available to the reader rather than being hidden inside a transformation.
On a real documentary page, replace the fictional description with the verified source identity and the actual bounded claim. Where a landmark identification is tentative, label it tentative. Where a reviewer has not established correspondence, do not make a connecting line appear to establish it for them.
An inset is another workable choice. A modern locator can orient the reader to the broad area while the old map remains an independent historical object. That design need not pretend the two images share a scale, north orientation, or measurable footprint. State what the locator locates and what it does not.
The non-overlay route is not a technical defeat. It may preserve the very discrepancy the documentary should investigate. A pitch can promise an inquiry without presenting its answer as already measured.
Preserve the operation behind the page
Keep the untouched scan, source identification, control-point record, withheld checks, transformation settings, derivative, and final caption separately retrievable. The pitch needs a readable comparison; the appendix needs enough information for someone else to understand how it was made.
For this exercise, the example record links the original images, native GeoTIFFs, coordinates, and results. The reproduction script calculates the affine transformation from controls and requests GDAL's TPS transformer through Rasterio. Rasterio documents both operations.[^5] No source map or outside service is needed to rerun the fictional case.
For a real map, an executable transformation still leaves historical interpretation and positional accuracy to appropriate review. It also says nothing about permission to reproduce the source. Keep those questions separate rather than letting a successful export answer all of them at once.
The final pitch page should let its reader distinguish three things: what the source depicts, what your transformation does, and what you infer from the comparison. If the overlay makes those distinctions harder to see, put the maps beside each other.
Sources
[^1]: Rasterio, “Georeferencing”, introduction, “Coordinate Transformation,” and “Ground Control Points.” Inspected September 19, 2026. Supports the distinction between coordinate systems and pixel-to-world transformation, not historical interpretation.
[^2]: QGIS, “11.3. Georeferencer,” version 3.44, “Entering ground control points” and “Available Transformation algorithms.” Inspected September 19, 2026. Version-pinned documentation; no claim that 3.44 is the latest release or that its interface was tested here.
[^3]: GDAL, “gdalwarp”, -order, -tps, and -r options. Inspected September 19, 2026. Describes the software's transformation and resampling controls, not the credibility of an overlay.
[^4]: Original fictional exercise, results and execution record, landmarks, and residuals. Executed September 19, 2026. Supports only the reported artificial comparison.
[^5]: Rasterio, “rasterio.transform module”, from_gcps and GCPTransformer; and “rasterio.warp module”, reproject, gcps, and transformer options. Inspected September 19, 2026. The supplied script records the actual execution versions separately from the documentation version.
Frequently asked questions
What should decide whether a historical map is georeferenced?
Georeference only as far as the correspondence between the two maps can be defended. Identify the same features, record why you believe they match, compare transformations, and check landmarks that did not help fit the image. If the operation makes the old map appear more precise than its evidence allows, use an unwarped comparison instead. That choice belongs to the documentary argument, not just the software settings.
Why can a perfect fit at control points be misleading?
In the fictional mill-yard example, the flexible TPS fit had effectively zero fitting error but moved the withheld footbridge by about 61.5 meters and curved a formerly straight road. A perfect fitting report shows the transformation fulfilled its instruction to place the supplied controls. It does not show that the whole image is accurate, so withheld checks can expose a failure the fit conceals.
What are control points and independent checks?
A ground control point pairs a location in the source image with a location in the reference coordinate system, asserting that this mark and that mark represent the same place. The software cannot supply the historical reason for believing that pairing. Some recognizable landmarks should be left out of the fit so they test locations the transformation was not instructed to satisfy. Moving a failed check into the fitting set removes that independence and requires recording the change and finding another challenge.
What does root mean square error mean in the example, and is it a universal cutoff?
Root mean square error here means squaring each landmark's two-dimensional displacement, averaging those squared distances, then taking the square root. It summarizes those particular points; it is not an accuracy certificate for the whole image. The 13.1 m and 54.0 m values describe a fictional grid with known construction. A real project's acceptable uncertainty depends on its claim, source, reference, and intended use.
When is an unwarped comparison the honest choice?
Choose it when an overlay would imply exact parcels, yard widths, river movement, or other claims the source cannot consistently support. Put the original plan beside the reference, connect features through labels rather than shared pixel positions, and keep both images geometrically untouched. An inset can orient readers to a broad area while the old map remains an independent historical object. This may preserve the very discrepancy the documentary should investigate.